Wilcoxon's rank sum test is one of standard methods for testing differentially expressed genes (DEG) in single cell analysis. It is said that this test is related to area under curve (AUC) in ROC curve typically used for machine learning etc https://en.wikipedia.org/wiki/Mann–Whitney_U_test , but it took me a while to see the relationship.
[Example A]
Let's think about a random variable e.g. X = {0.1, 0.9, 0.4, 0.6, 0.8}.
We also typically have labels for these values: C = {0, 1, 0, 1, 1}.
We also typically have labels for these values: C = {0, 1, 0, 1, 1}.
In the context of DEG analysis, X is gene expression level, and C is cluster ID. In the context of machine learning, X is the probability of being "True" calculated by a machine learning model, and C is the ground truth.
[Definition of U statistic]
U statistics in Wilcoxon's rank sun test is calculated as:
The smaller value between U1 and U2 where U1 and U2 are defined as,
The smaller value between U1 and U2 where U1 and U2 are defined as,

n1: the number of samples labeled as 0 (group 1; negative cases)
n2: the number of samples labeled as 1 (group 2; positive cases)
R1, R2: the sum of the ranks of values in group 1 and 2, after pooling all the samples in one set.
n2: the number of samples labeled as 1 (group 2; positive cases)
R1, R2: the sum of the ranks of values in group 1 and 2, after pooling all the samples in one set.
(from wikipedia)
In the above example,
n1=2, n2= 3, R1=1+2=3, R2=3+4+5=12,
U1=6+6-12=0, U2=6+3-3=6.
U = U1 = 0.
U1=6+6-12=0, U2=6+3-3=6.
U = U1 = 0.
In fact, using R,

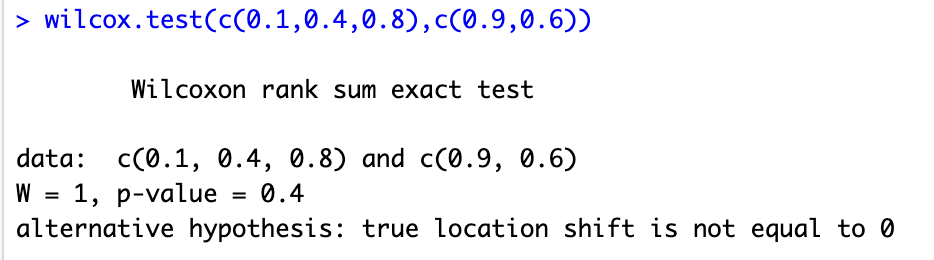
(Note that the statistic is denoted as W.)
[Definition of AUC using U statistic]
AUC can be calculated using the U value for positive case, i.e. U2 (while in the wikipedia it is denoted by U1).
AUC = U2/(n1 x n2) = 6/6 = 1.
This makes sense because the label corresponds to high probability in the above case.
[Example B]
If I introduce some error, i.e. X = {0.1, 0.9, 0.4, 0.6, 0.8}, C = {0, 1, 0, 1, 0},
n1=3, n2=2, R1=1+2+4=7, R2=3+5=8,
U1=6+3-8=1, U2=6+6-7=5, U = U1 = 1.
AUC = U2/(n1 x n2) = 5/6= 0.83 <-- Reduced from 1 due to the error.