News

New paper!

Tuesday, December 3, 2024

Statistics: Anova and Tukey

ANOVA, Tukey, and their non-parametric versions

One-way ANOVA

A parametric test designed to compare the means of two or more samples.

H0: the means of all samples are equal.

Assumptions:

  • Normality (each sample is taken from a normally distributed population)
  • Sample independence
  • Variance equality, i.e. homoscedasticity (that the variance of data in the different groups should be the same)

(From my previous F test blog)

For ANOVA, F statistic is

        F = (explained variance) / (unexplained variance), or

        F = (between-group variability) / (within-group variability) .

In both cases, F takes a form of the sum of the square of differences between a set of values of interest and overall mean (which is conceptually related to variance or variability).


What would be two-way ANOVA??

Two-way ANOVA examines the effect of two factors on a dependent variable, and also examines whether the two factors affect each other to influence the continuous variable.


What’s ANOVA’s role in typical linear regression output?

http://www.stat.yale.edu/Courses/1997-98/101/anovareg.htm

It is about how well the model fits, from the perspective of variance. F statistic becomes large when the explanatory variable(s) explain the data well, such that the data groupings by the variable increases F statistic, i.e. how well the model fits (the model sum of square variance) with respect to the residual (mean square error). 

R2 in the linear regression can be also described based on the products from ANOVA: r2 = SSM/SST; <model sum of square variance, how well the model fits> divided by <total sum of square variance>

In multiple linear regression, H0 in the F test is all coefficients are 0. H1 is at least one of them is non-zero.


Tukey’s range test (or Tukey’s post hoc test)

  • It is like t-test.
  • Normality, Sample independence, Variance equality, i.e. homoscedasticitythe same) should be met.
  • Take a pairs of max mean and min mean across groups.
  • Compute the statistic q_s  =  (max_mean - min_mean) / SE,
    where SE = sqrt(MSw / n), MSw is the Mean Square Within (from ANOVA) and n is the number of samples in each group.
    MSw = SS_within / df_within = SUM_k[(n-1) x (std.dev. for each group k)] / [# of total individuals - k]
  • Compare against a critical q value (a value from the q table with a specific significance level, “degrees of freedom Within” from ANOVA, and the number of groups)
  • If the q_s is larger than the critical q value, the two means are significantly different at the significance level.
  • The sample size needs to be the same across groups.
    If not, use Tukey-Kramer test https://real-statistics.com/one-way-analysis-of-variance-anova/unplanned-comparisons/tukey-kramer-test/
    which replaces 2/n with (1/n_i + 1/n_j)


So, whether running Tukey for all possible pairs or only some of them does not seem to affect Tukey’s results. So, there seems no point doing ANOVA before Tukey (this discussion agrees too https://www.reddit.com/r/AskStatistics/comments/xwmzy8/anova_why_bother_if_you_can_run_posthoc_ttests/ )


What to do when the data is not normally distributed

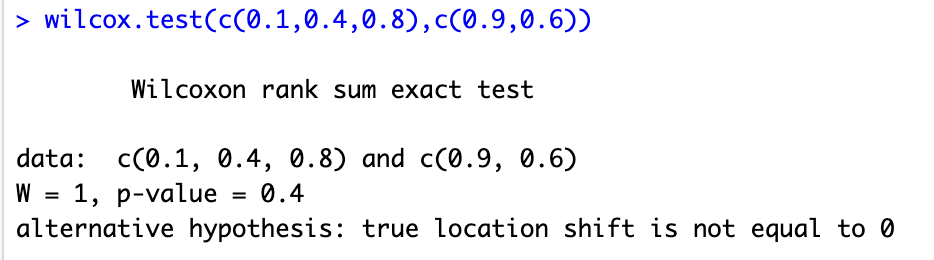
Kruskal-Wallis test is the non-parametric counterpart of ANOVA. https://en.wikipedia.org/wiki/Kruskal–Wallis_test “For analyzing the specific sample pairs for stochastic dominance, Dunn's test pairwise Mann–Whitney tests with Bonferroni correction, or the more powerful but less well known Conover–Iman test are sometimes used.”


Why ANOVA and Tukey not used in ggbetweenstats??

Welch's F test instead of ANOVA: https://rips-irsp.com/articles/10.5334/irsp.198

"Student’s t-test and classical F-test ANOVA rely on the assumptions that two or more samples are independent, and that independent and identically distributed residuals are normal and have equal variances between groups." ... "Under realistic deviations from the assumption of equal variances, the classic F-test can yield severely biased results and lead to invalid statistical inferences. We examine two common alternatives to the F-test, namely the Welch’s ANOVA (W-test) and the Brown-Forsythe test (F*-test). Our simulations show that under a range of realistic scenarios, the W-test is a better alternative and we therefore recommend using the W-test by default when comparing means."


Games-Howell instead of Tukey: Probably because of the feature explained in this blog https://oceanone.hatenablog.com/entry/2020/06/28/035710 
It says that Games-Howell test is an alternative to Tukey-Kramer; while Tukey-Kramer requires homogenous variances, Games-Howell does not assume that. This makes Games-Howell applicable to wider cases, in the expense of statistical power when the variance in data is homogenous.

Conda environment control (with miniconda3)

 Conda environment control (the example is particularly for Linux)

  1. Download miniconda3 installer of your preference e.g.
    mkdir -p ~/miniconda3
    curl https://repo.anaconda.com/miniconda/Miniconda3-latest-Linux-x86_64.sh -o ~/miniconda3/miniconda.sh

  2. Install miniconda3 (as described here https://docs.conda.io/projects/conda/en/stable/user-guide/install/linux.html)
    bash ~/miniconda3/miniconda.sh -b -u -p ~/miniconda3
    rm -rf ~/miniconda3/miniconda.sh

  3. Initialize conda (i.e. define conda commands and set up PATH)
    It might be done by `conda init` or something (I’m not sure) but what needs to be done is add this to ~/.bashrc and/or ~/.bash_profile
    # >>> conda initialize >>>
    # !! Contents within this block are managed by 'conda init' !!
    __conda_setup=“$(‘<path_to_the_miniconda3_you_want_to_use>/miniconda3/bin/conda' 'shell.bash' 'hook' 2> /dev/null)"
    if [ $? -eq 0 ]; then
      eval "$__conda_setup"
    else
      if [ -f "<path_to_the_miniconda3_you_want_to_use>/miniconda3/etc/profile.d/conda.sh" ]; then
        . "<path_to_the_miniconda3_you_want_to_use>/miniconda3/etc/profile.d/conda.sh"
      else
        export PATH="<path_to_the_miniconda3_you_want_to_use>/miniconda3/bin:$PATH"
      fi
    fi
    unset __conda_setup
    # <<< conda initialize <<< 


Note that if PATH contains something else (e.g. <your_home_dir>/.local/bin) before <path_to_the_miniconda3_you_want_to_use>, the thing that comes earlier in the PATH will be prioritized. For example. If <your_home_dir>/.local/bin contains things installed by `pip` etc, they can interfere conda environment. For me, adding the lines below to ~/.bash_profile solved the issue, by making sure that the things in .bashrc are executed upon logging in:
if [ -f ~/.bashrc ]; then

   . ~/.bashrc

fi


        4. Now you should be able to access conda environment that’s stored under <path_to_the_miniconda3_you_want_to_use>/miniconda3/envs/ !!


        5. To create a new conda environment (e.g. containing a specific package like python=3.8):
            conda create -n myenv python=3.8 https://docs.conda.io/projects/conda/en/latest/commands/create.html

        
        6. Activate the conda environment and install packages for example,
                conda activate myenv
                conda install numpy matplotlib pandas

scRNA: SCTransform (Seurat v5)

It seems default SCTransform subsamples 5000 cells (as specified by ncells=5000), and min_cells condition is applied on "the subsampled cells"–it checks whether a gene is expressed in at least in <min_cells> cells across the subsampled cells, whereas CreatSeuratObject checks the same thing across all cells, if I understand correctly. If one does not want to change the number of genes at SCTransform, min_cells=0 or ncells=<total number of cells in the object> would do.

Tuesday, June 18, 2024

When is one-tailed test appropriate?

This page seems to explain well the usage of one-tailed vs two-tailed test.

(remark: one-tailed test becomes less stringent than two-tailed test.)

https://stats.oarc.ucla.edu/other/mult-pkg/faq/general/faq-what-are-the-differences-between-one-tailed-and-two-tailed-tests/

How to set max memory usage in RStudio

Make .Renviron and add a line like this to specify a max memory (beyond which the job will be killed)
R_MAX_VSIZE=100Gb
https://bioinfocore.com/unix/r-set-memory-limit-on-mac-for-rstudio/


New paper!

New paper "Trait selection strategy in multi-trait GWAS: Boosting SNPs discoverability" has been published! https://www.cell.com/hgg-advances/fulltext/S2666-2477(24)00058-7

For the user of multi-trait GWAS, a question to think about when using the method is which traits to analyze together. As we show in this paper, the performance of multi-trait GWAS (i.e. the number of new associations) depends on the combination of traits.

Thus, we addressed the question of how should we select traits to be analyzed by multi-trait GWAS so that the performance improves. An interesting take-away message is that a common strategy (i.e. selecting clinically similar traits) does not particularly do well. Our model analysis provides the features that impact the performance of multi-trait GWAS, which can be leveraged in future studies to improve detecting associations in complex traits.

Monday, May 20, 2024

Started a new position

I have started working at KOTAI Biotechnologies as a bioinformatician!

I will be working on bioinfo analyses with a strong focus on the communication between bioinfo analysis and clients. 

Very excited that this position requires the combination of skills I have developed so far.

I am hoping that I can use my skills more directly to contribute to other people and the society.

Wilcoxon test and AUC

 Wilcoxon's rank sum test is one of standard methods for testing differentially expressed genes (DEG) in single cell analysis. It is said that this test is related to area under curve (AUC) in ROC curve typically used for machine learning etc https://en.wikipedia.org/wiki/Mann–Whitney_U_test , but it took me a while to see the relationship.

[Example A]
Let's think about a random variable e.g. X = {0.1, 0.9, 0.4, 0.60.8}.
We also typically have labels for these values: C = {0, 1, 0, 11}. 

In the context of DEG analysis, X is gene expression level, and C is cluster ID. In the context of machine learning, X is the probability of being "True" calculated by a machine learning model, and C is the ground truth.

[Definition of U statistic]
U statistics in Wilcoxon's rank sun test is calculated as:
The smaller value between U1 and U2 where U1 and U2 are defined as,
n1: the number of samples labeled as 0 (group 1; negative cases)
n2: the number of samples labeled as 1 (group 2; positive cases)
R1, R2: the sum of the ranks of values in group 1 and 2, after pooling all the samples in one set.
(from wikipedia)

In the above example,

    n1=2, n2= 3, R1=1+2=3, R2=3+4+5=12,        
    U1=6+6-12=0, U2=6+3-3=6.                   
    U = U1 = 0.                                                                                                                                                    

In fact, using R,
(Note that the statistic is denoted as W.)


[Definition of AUC using U statistic]
AUC can be calculated using the U value for positive case, i.e. U2 (while in the wikipedia it is denoted by U1).
    AUC = U2/(n1 x n2) = 6/6 = 1.
This makes sense because the label corresponds to high probability in the above case.

[Example B]
If I introduce some error, i.e. X = {0.1, 0.9, 0.4, 0.6, 0.8}, C = {0, 1, 0, 10},
n1=3, n2=2, R1=1+2+4=7, R2=3+5=8,
U1=6+3-8=1, U2=6+6-7=5, U = U1 = 1.
AUC = U2/(n1 x n2) = 5/6= 0.83 <-- Reduced from 1 due to the error.


Add virtual environment to Jupyter notebook

Original source here https://janakiev.com/blog/jupyter-virtual-envs/ 

Steps

1. Create a virtual environment (with pip or conda. here showing a version with pip)

$python3 -m vent <name_of_env>

$source <name_of_env>/bin/activate


2. Install `ipykernel` package

$python3 -m pip install ipykernel


3. Add virtual environment to Jupyter notebook

$python3 -m ipykernel install --user --name=<name_of_env>


4. Remove virtual environment from Jupyter notebook

$jupyter kernelspec list # This should return a list of available environments

$jupyter kernelspec uninstall <name_of_env>

Wednesday, February 7, 2024

New paper! in the American Naturalist

Our paper "The stability of competitive metacommunities is insensitive to dispersal connectivity in a fluctuating environment" is finally published!

https://www.journals.uchicago.edu/doi/10.1086/729601

In this study, we investigated spatial factors that could impact the stability of metacommunity using simulations with spatiotemporally different environmental settings. 

While many previous studies on metacommunity stability exist, the challenge was the large number of parameters in the system and different focuses between previous studies. We developed simulations with flexible settings to address this challenge.

Our analysis suggested that the size of metacommunity was important on metacommunity stability; While the impact of the size itself was not surprising, it was surprising that its impact often dominated other spatial factors such as topology and dispersal rate. 

We showed that the impact of size was associated with the number of fluctuation regimes in environmental condition.

Git: how to handle divergent branches

$ git pull origin master
--> oops! hint: You have divergent branches and need to specify how to reconcile them.
Divergent branches occur when both master branch and your feature branch (your origin, i.e. remote branch, or any other branch that one created) have accumulated new commits. (so the repository graph looks like Y shape).

[Option 1: recommended when the other branch your getting changes from is shared with others] 

You can then do $ git pull --no-rebase origin master
This will merge the two branches at the end, incorporating commits from both branches, and bring master to the tip (merged point).

[Option 2: recommended when you are handling two branches that are not shared with others] 

In contrast, $ git pull --rebase origin master
This will rewrite the commit history and merge two branches such that there is only one sequence of commit histories. A merit is a cleaner commit history, but should be used with a caution when others are involved, as reverting is harder with rebasing than merging.


These articles a good description of the difference between merge and rebase: link and link2

Saturday, October 7, 2023

How to connect a directory to Github


1. Move to your local directory of interest.
2. $ git init : to initiate git function in the directory.
3. $ git add xxx : add a file (e.g. .gitignore) to be tacked by git.
4. $ git commit -m "..." : commit the change.
5. Generate a new project on Github, and obtain the address under 'clone' (No need to create README)
6. $ git remote add origin [repo address]
7. $ git push -u origin master


*Note: the address starting with "git@.." is for SSH, while "https://" is for the use without it.

Monday, June 26, 2023

日本エピジェネティクス研究会2023

I attended the annual meeting of the Japanese Society for Epigenetics in Tokyo, Japan, 19-20 June 2023. Presented a poster "Linking SNPs to genes: toward a functional understanding of SNPs in human complex traits."
Coming from the field of human genetics, I found both overlaps and differences in epigenetics studies. Within the overlap, the combination of genetics and epigenetics seems to help obtain more context specific signals. Outside the overlap, genetics and epigenetic studies would find different signals (though it is probably difficult to argue whether a signal is causal or consequential in some of the epigenetic studies). 
It's always fascinating to get exposed to related but different fields!!

Saturday, April 22, 2023

EMGM 2023, University of Surrey, UK

I participated in EMGM 2023 at University of Surrey in UK. 
I gave a talk about our ongoing study about multi-trait GWAS, particularly investigating the impact of the choice of traits to analyse together. We are finalising the analysis and a manuscript (hope to submit it soon!)
There were many interesting topics about multivariate GWAS, PRS, mendelian randomisation, Bayesian methods, etc. Fascinating and motivated to learn more! The conference had a very cozy atmosphere as well.


Thursday, February 9, 2023

Generate a graph from adjacency matrix

import igraph as ig
import numpy as np

matrix = np.array([[0, 0.1, 0.2],[0, 0, 0.1],[0,0,0]])
g = ig.Graph.Adjacency((matrix > 0).tolist())
g.es['weight'] = matrix[matrix.nonzero()]
g.vs['label'] = node_label # a list of node labels

* To generate an UNDIRECTED graph, use 'mode=ig.ADJ_UPPER' :
g = ig.Graph.Adjacency((matrix > 0).tolist(), mode=ig.ADJ_UPPER)

Otherwise, if a matrix is symmetric and supposed to be for an undirected graph, the function will assign redundant edges. e.g. 

>>> mat = array([[0. , 0.1, 0.2], [0.1, 0. , 0.1], [0.2, 0.1, 0. ]]) # a symmetric matrix

>>> g = ig.Graph().Adjacency((mat>0).tolist())

>>> g.es['weight'] = mat[mat.nonzero()]

>>> list(g.get_edgelist())

[(0, 1), (0, 2), (1, 0), (1, 2), (2, 0), (2, 1)] # contains edges into both directions


In contrast, if you use 'mode=ig.ADJ_UPPER' for the same symmetric matrix :

>>> g = ig.Graph().Adjacency((mat>0).tolist(),mode=ig.ADJ_UPPER)

>>> g.es['weight'] = mat[mat.nonzero()]

>>> list(g.get_edgelist())

[(0, 1), (0, 2), (1, 2)]

Thursday, January 5, 2023

Print and save immediately during a loop in Python

Here https://stackoverflow.com/questions/33178514/how-do-i-save-print-statements-when-running-a-program-in-slurm , multiple methods to print and save (write) in a file immediately even during a loop in Python. One of them (by Manu) worked for me (inside a Python loop in slum job).


import builtins
import os
import sys

def printsync(text):
    builtins.print(text)
    os.fsync(sys.stdout)

sys.stdout = open(output_file, 'w', buffering=1)
for j in range(1000):
    printsync('Immediate output', j)    


Wednesday, December 14, 2022